SNCF Datascape
A journey through data
2018
Project Type
Data visualisation
Client
SNCF
Agency
SUPERBIEN
My role
Main visual concept, Art Direction, Data managment, visual programming
Tools
Notch, VVVV
Data visualisation
Client
SNCF
Agency
SUPERBIEN
My role
Main visual concept, Art Direction, Data managment, visual programming
Tools
Notch, VVVV
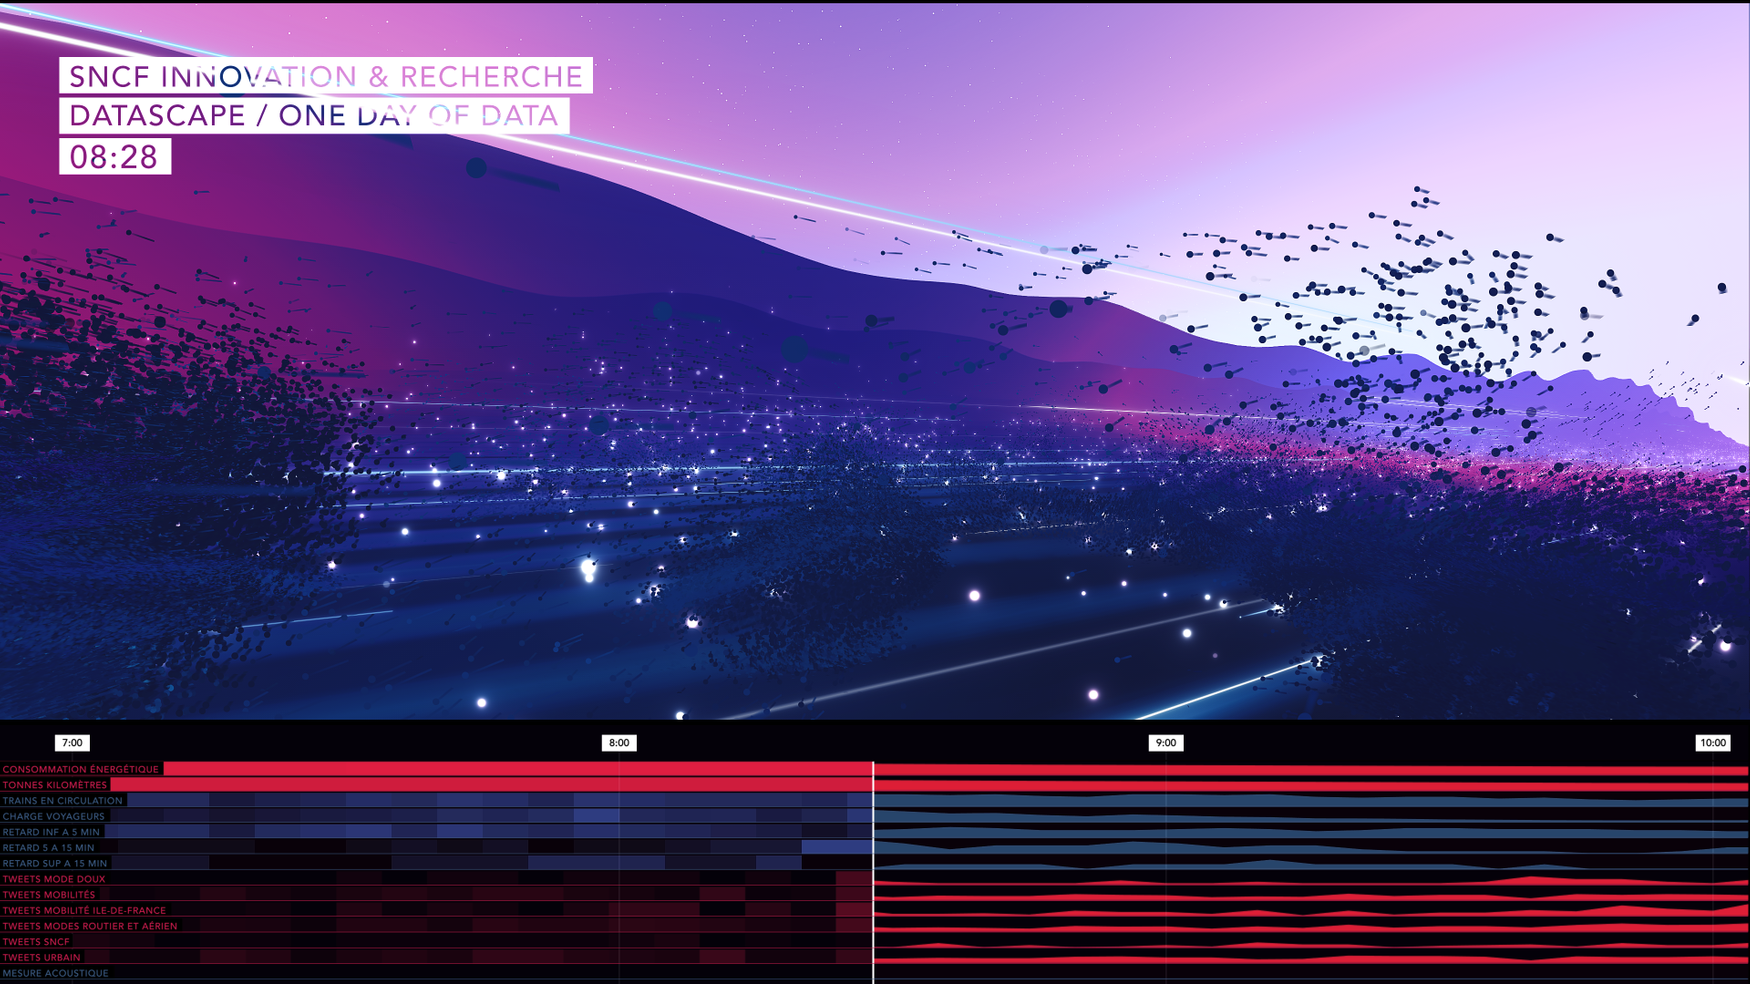
For several years, SNCF Innovation & Research (French railway services)has been exploring data visualization. For this new visualization, the partnership with the multidisciplinary creation studio Superbien makes it possible to offer a trip through SNCF data.
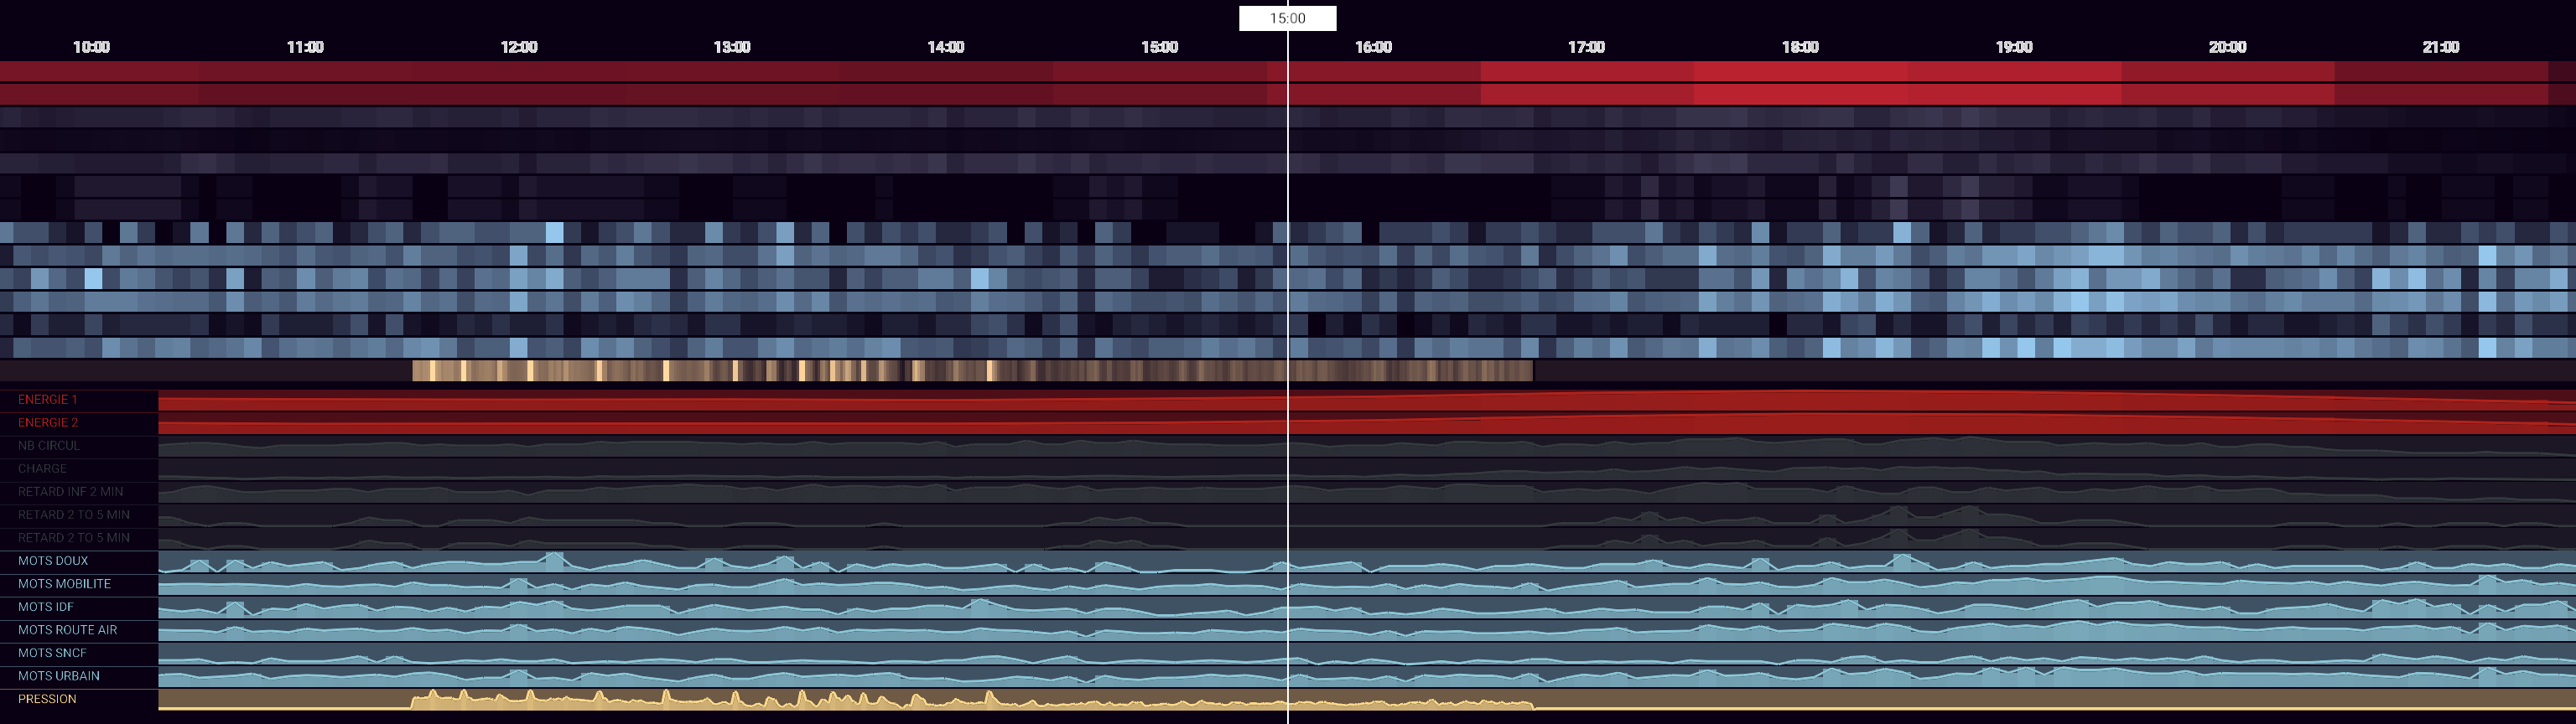
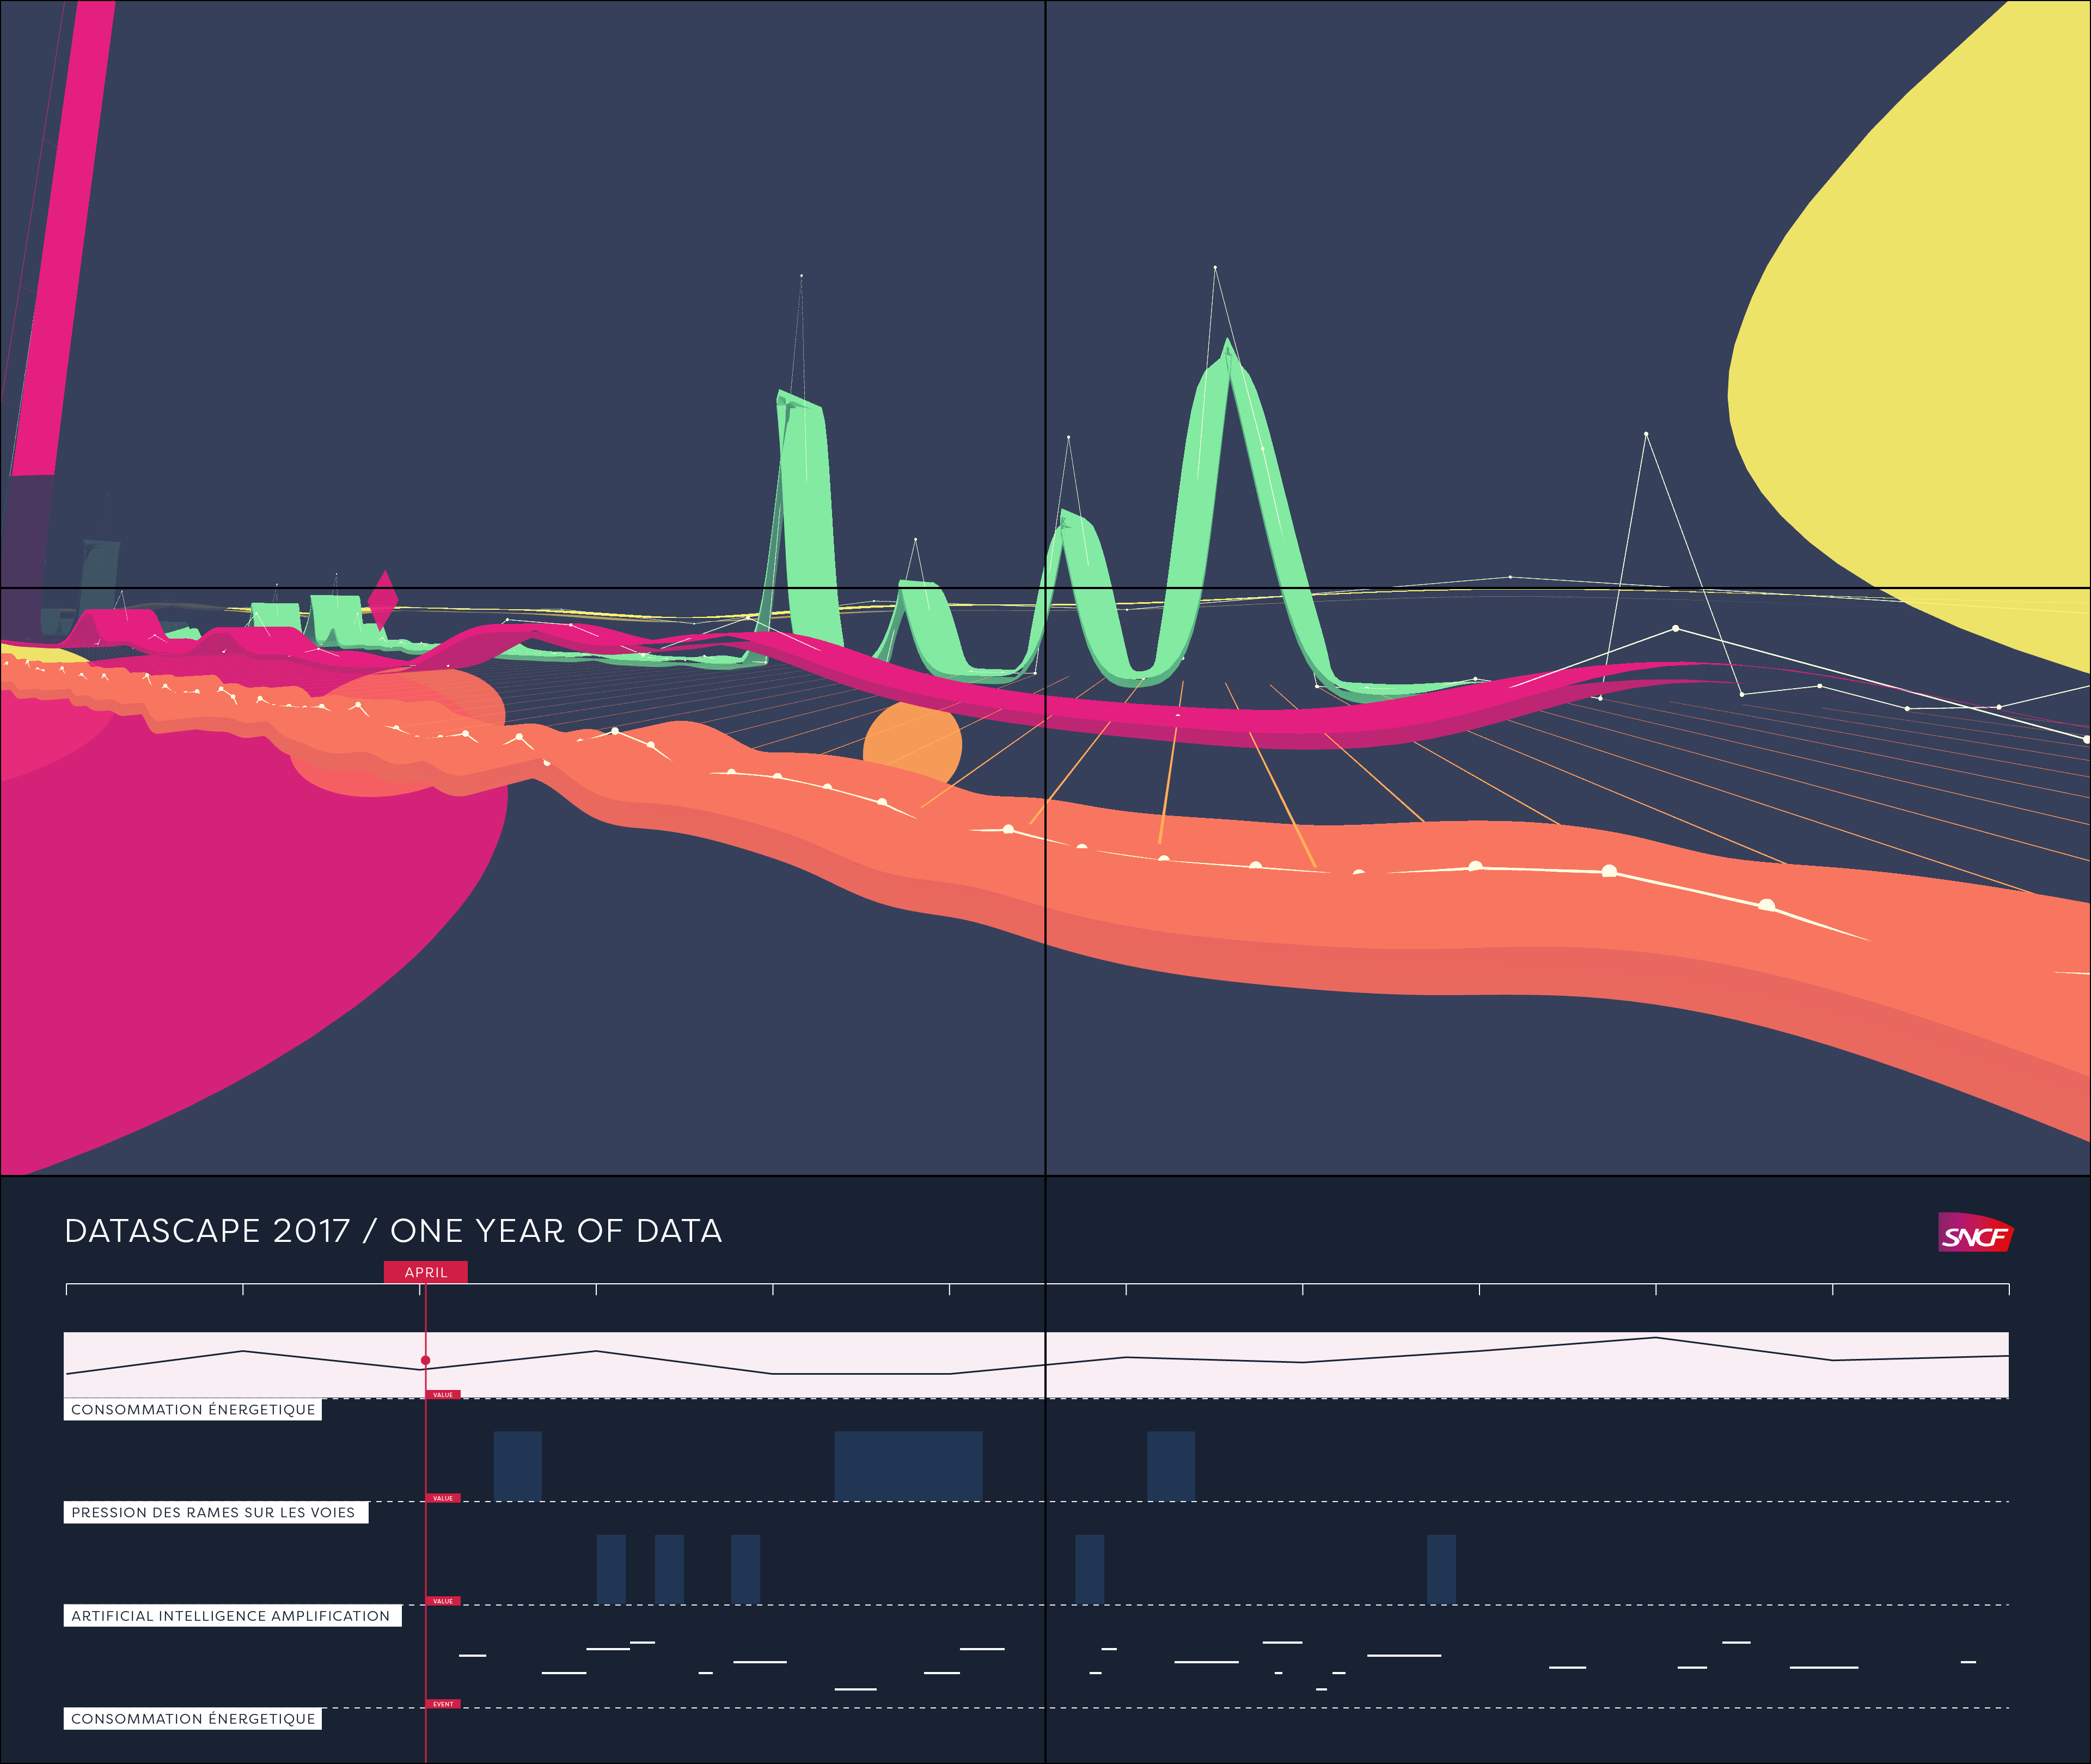
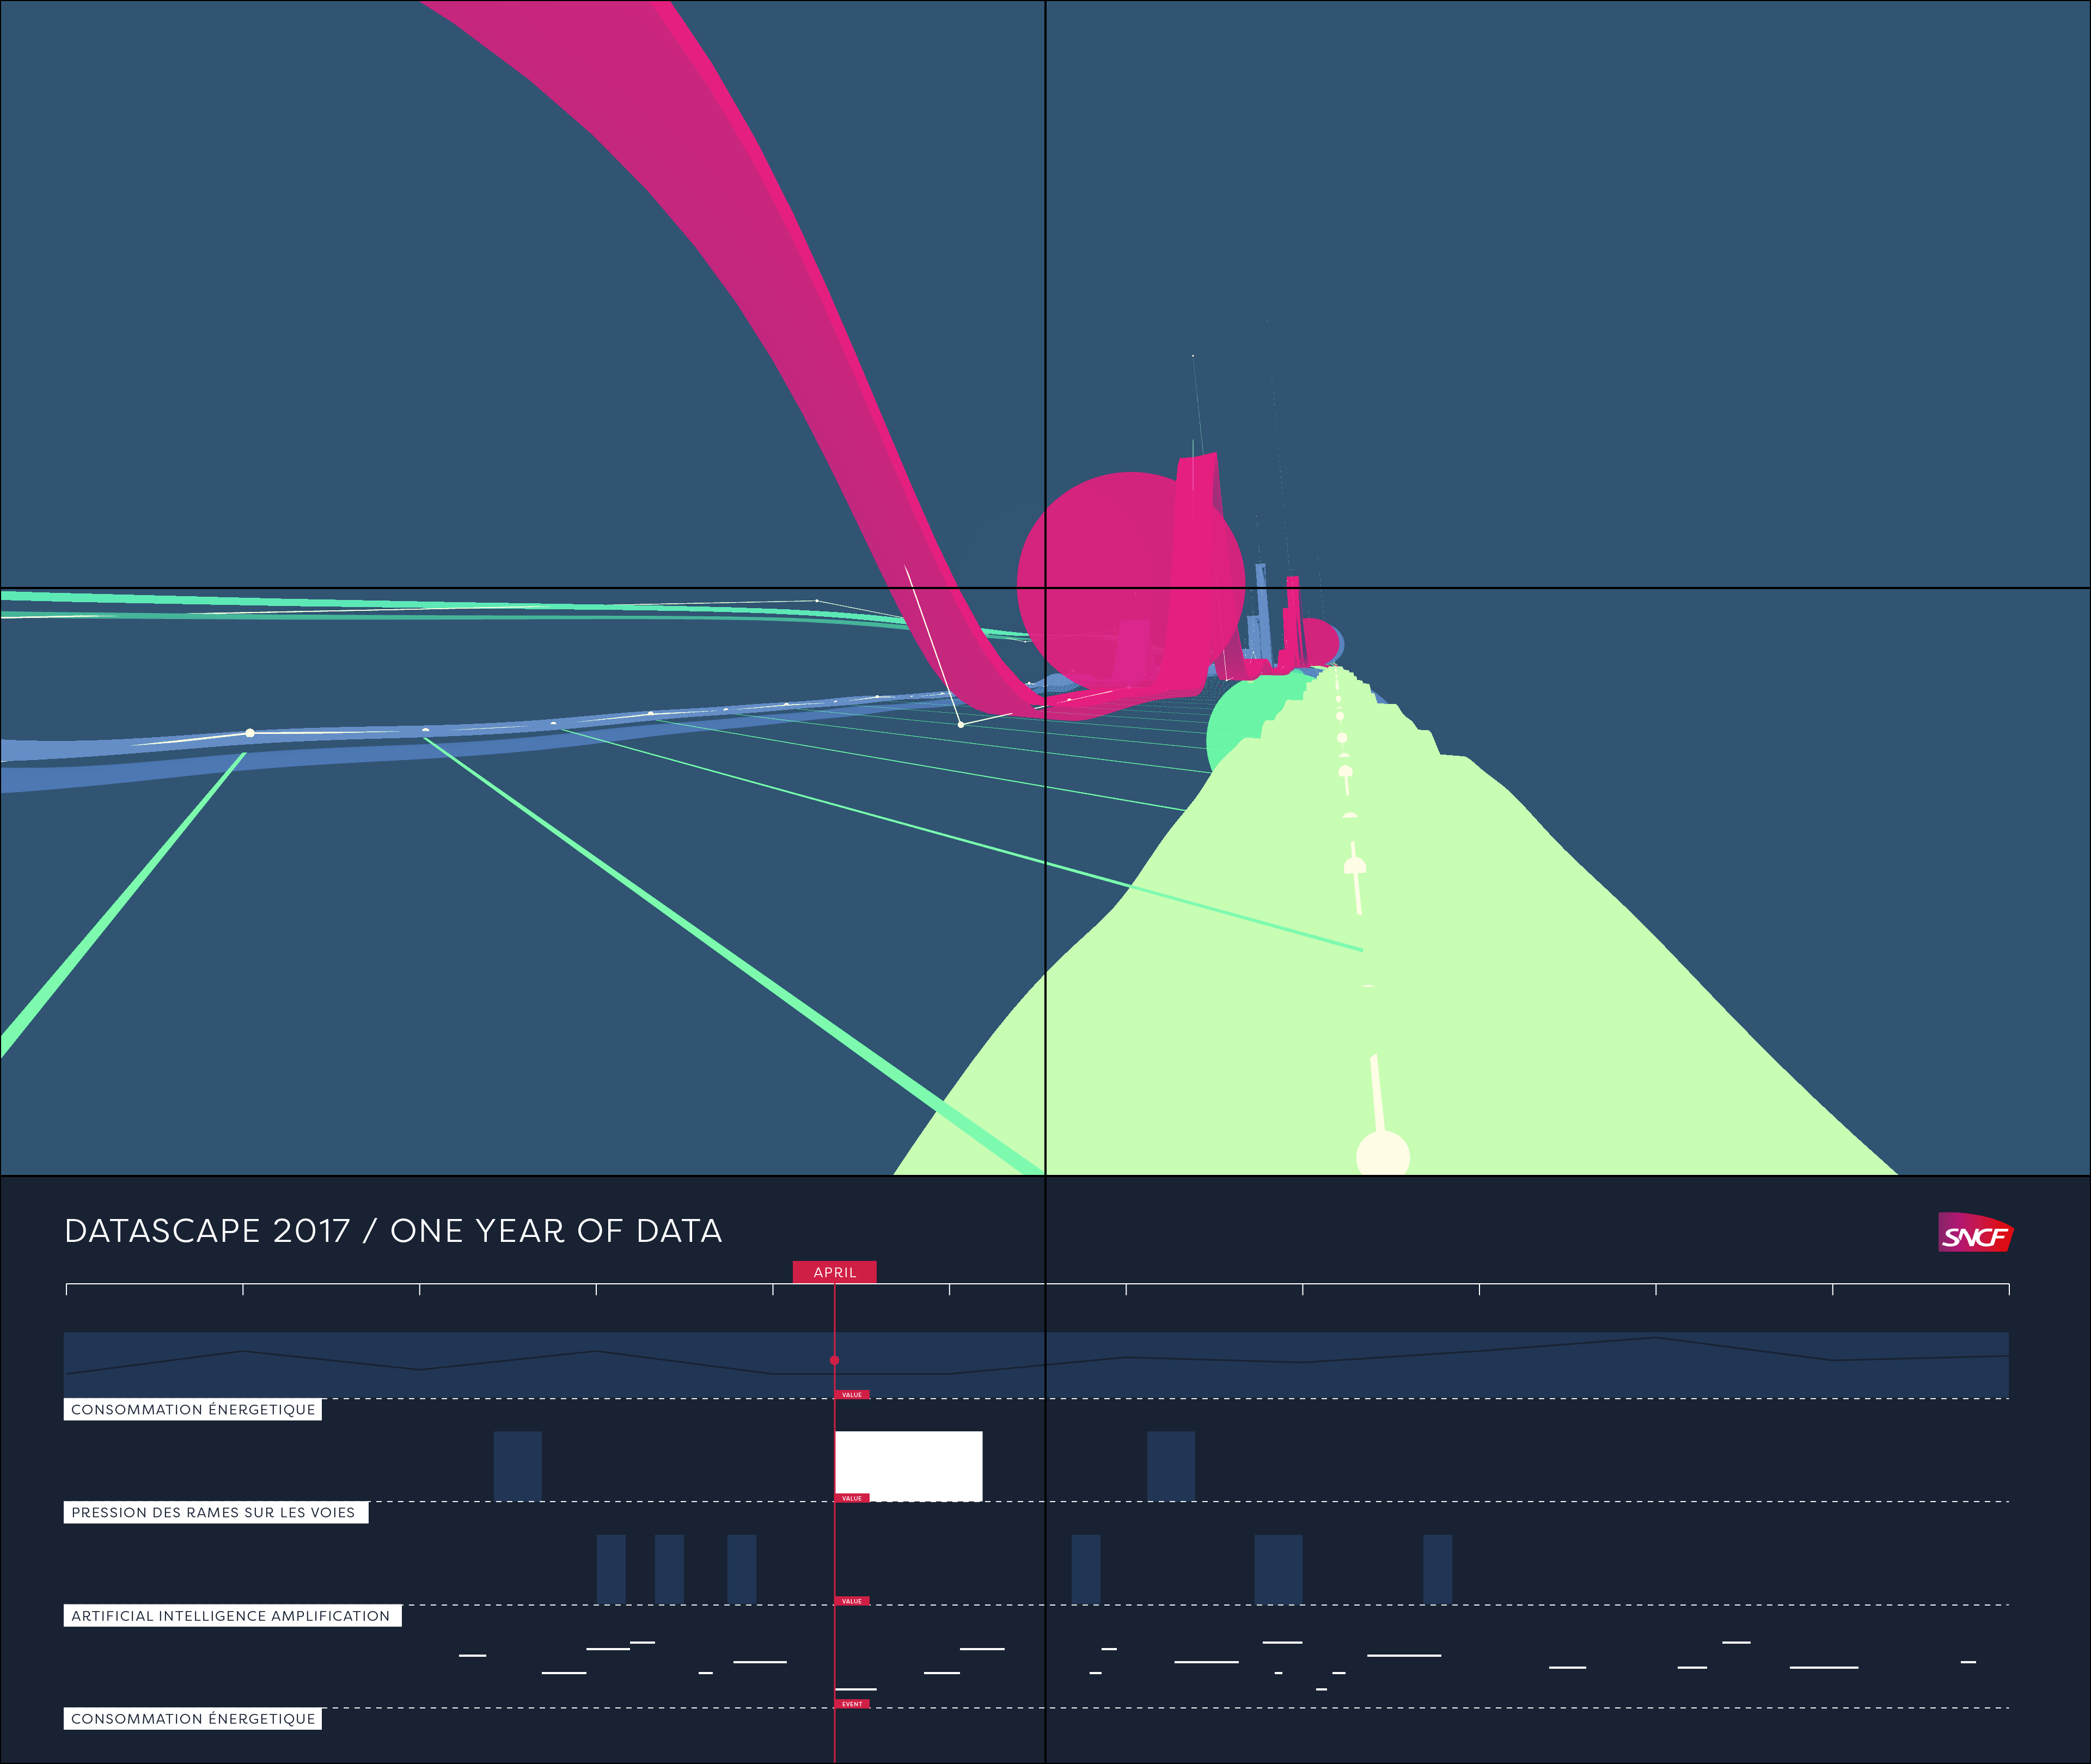
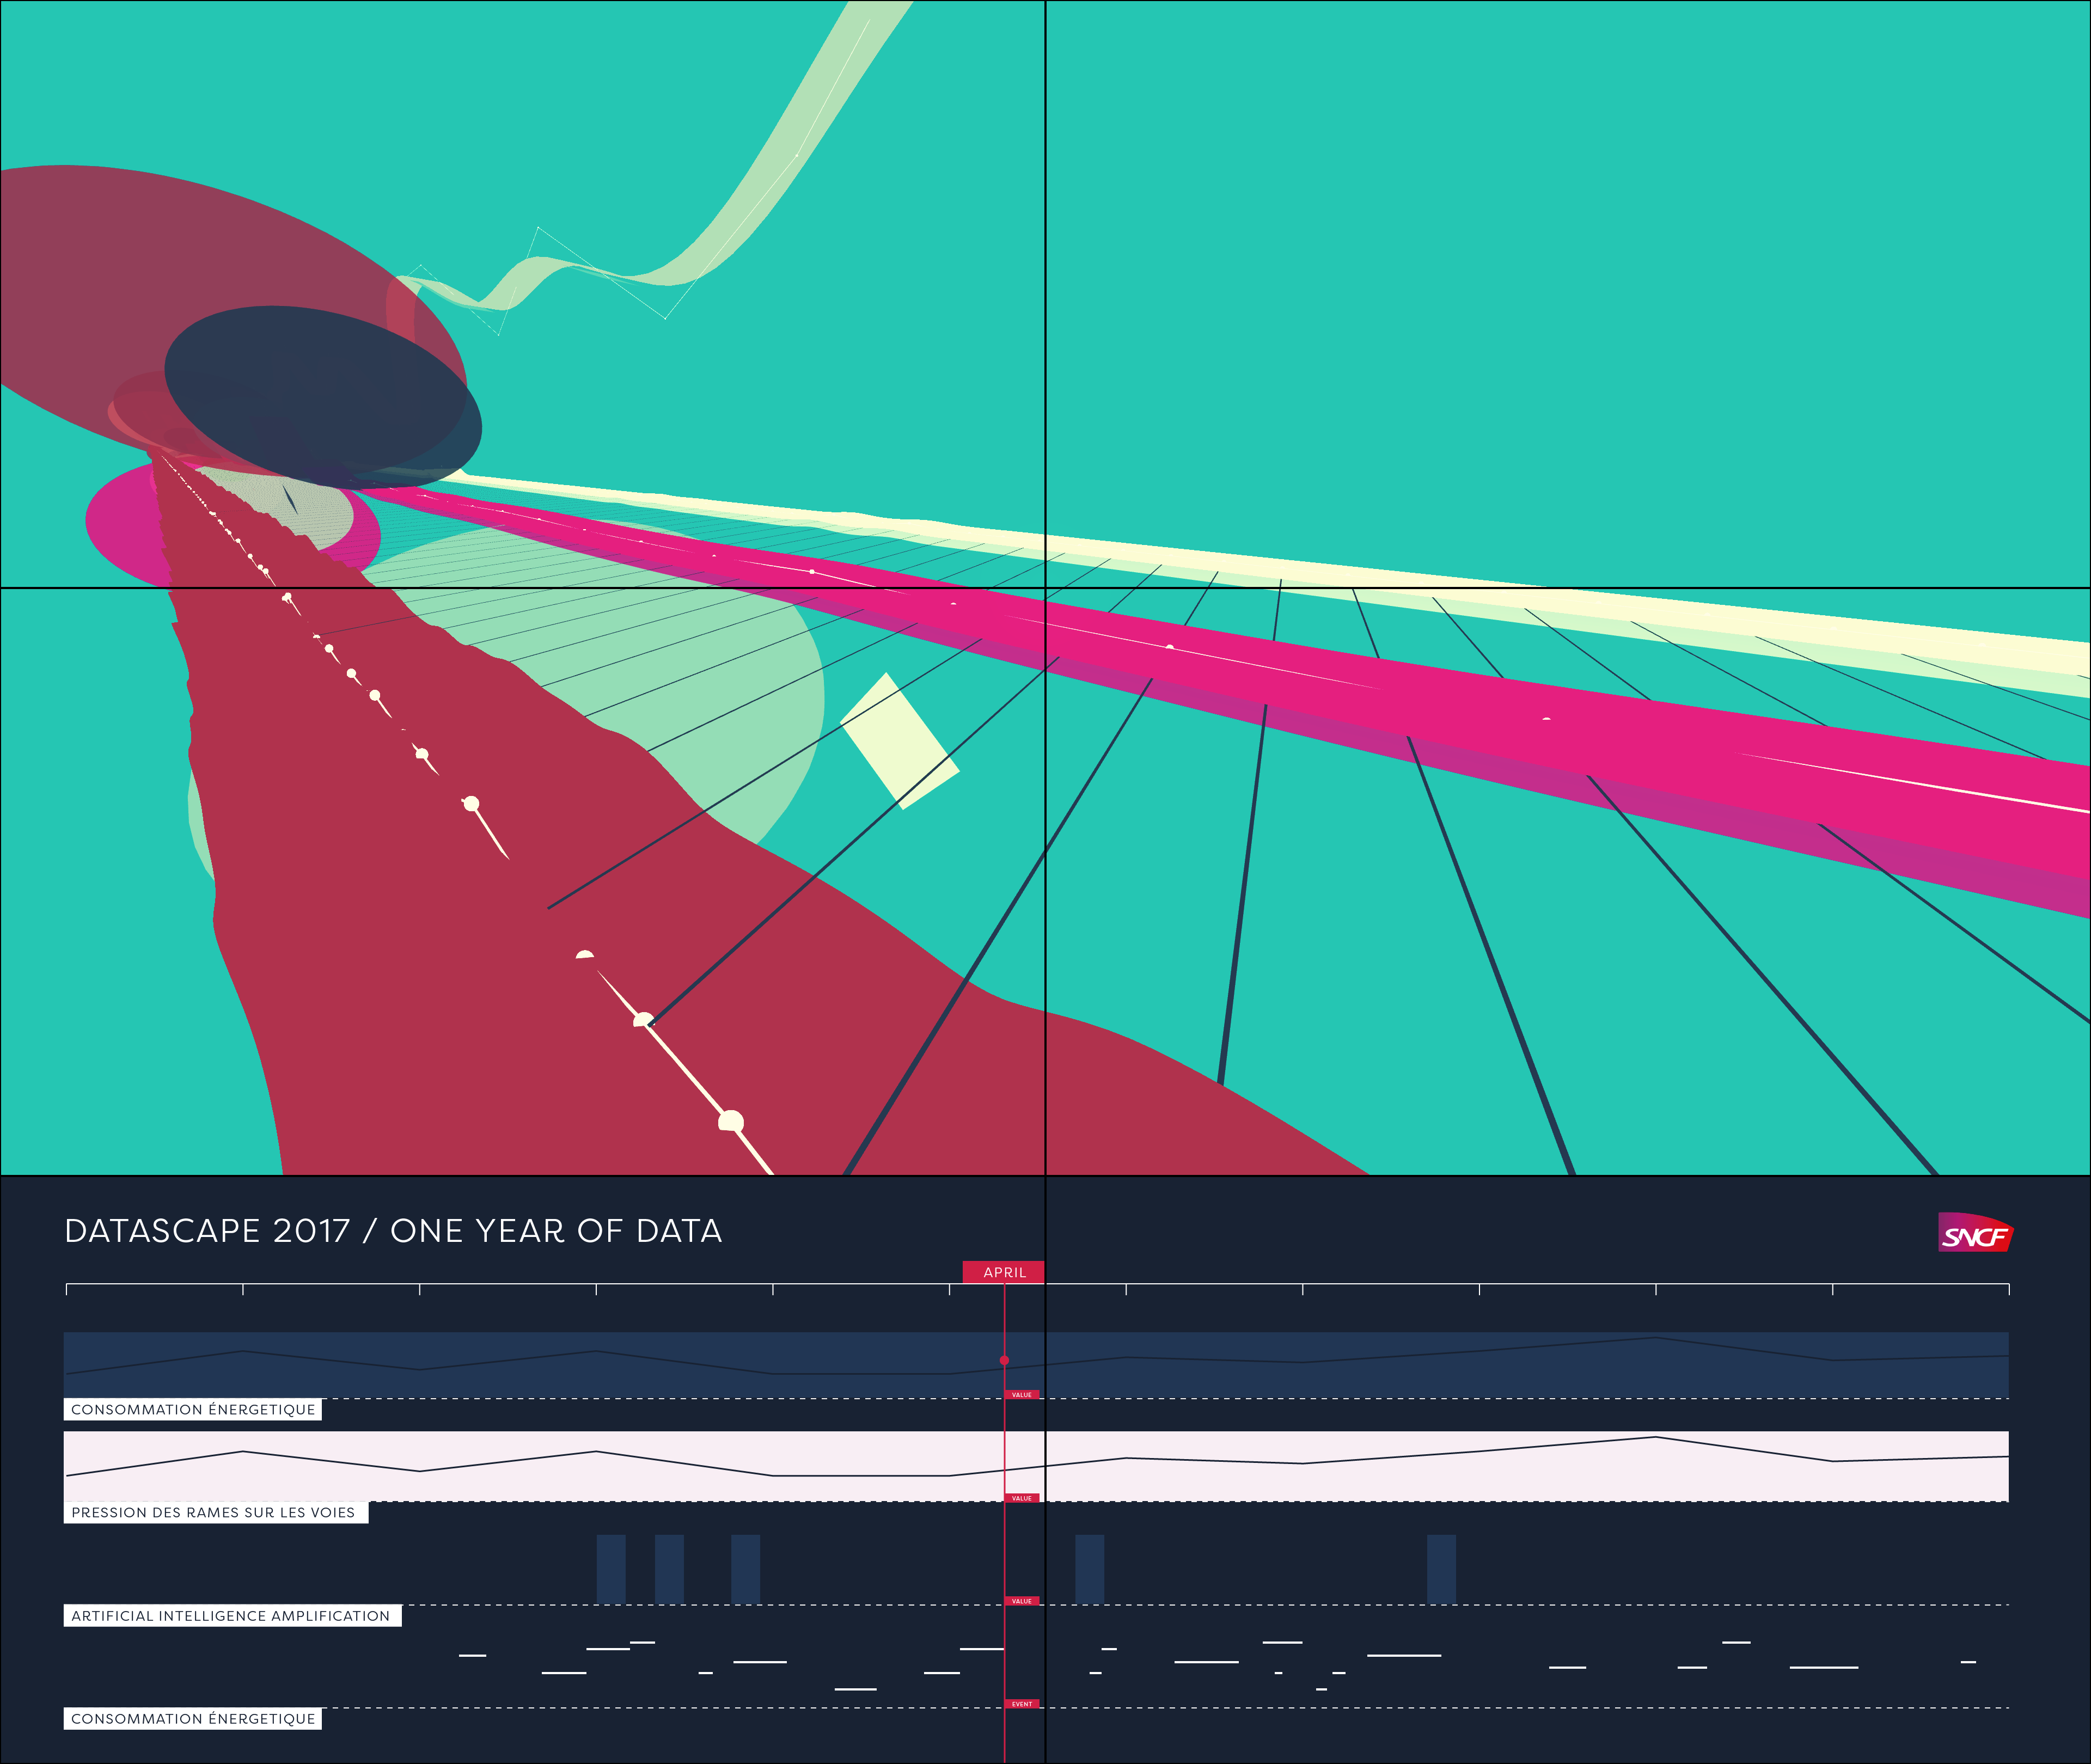
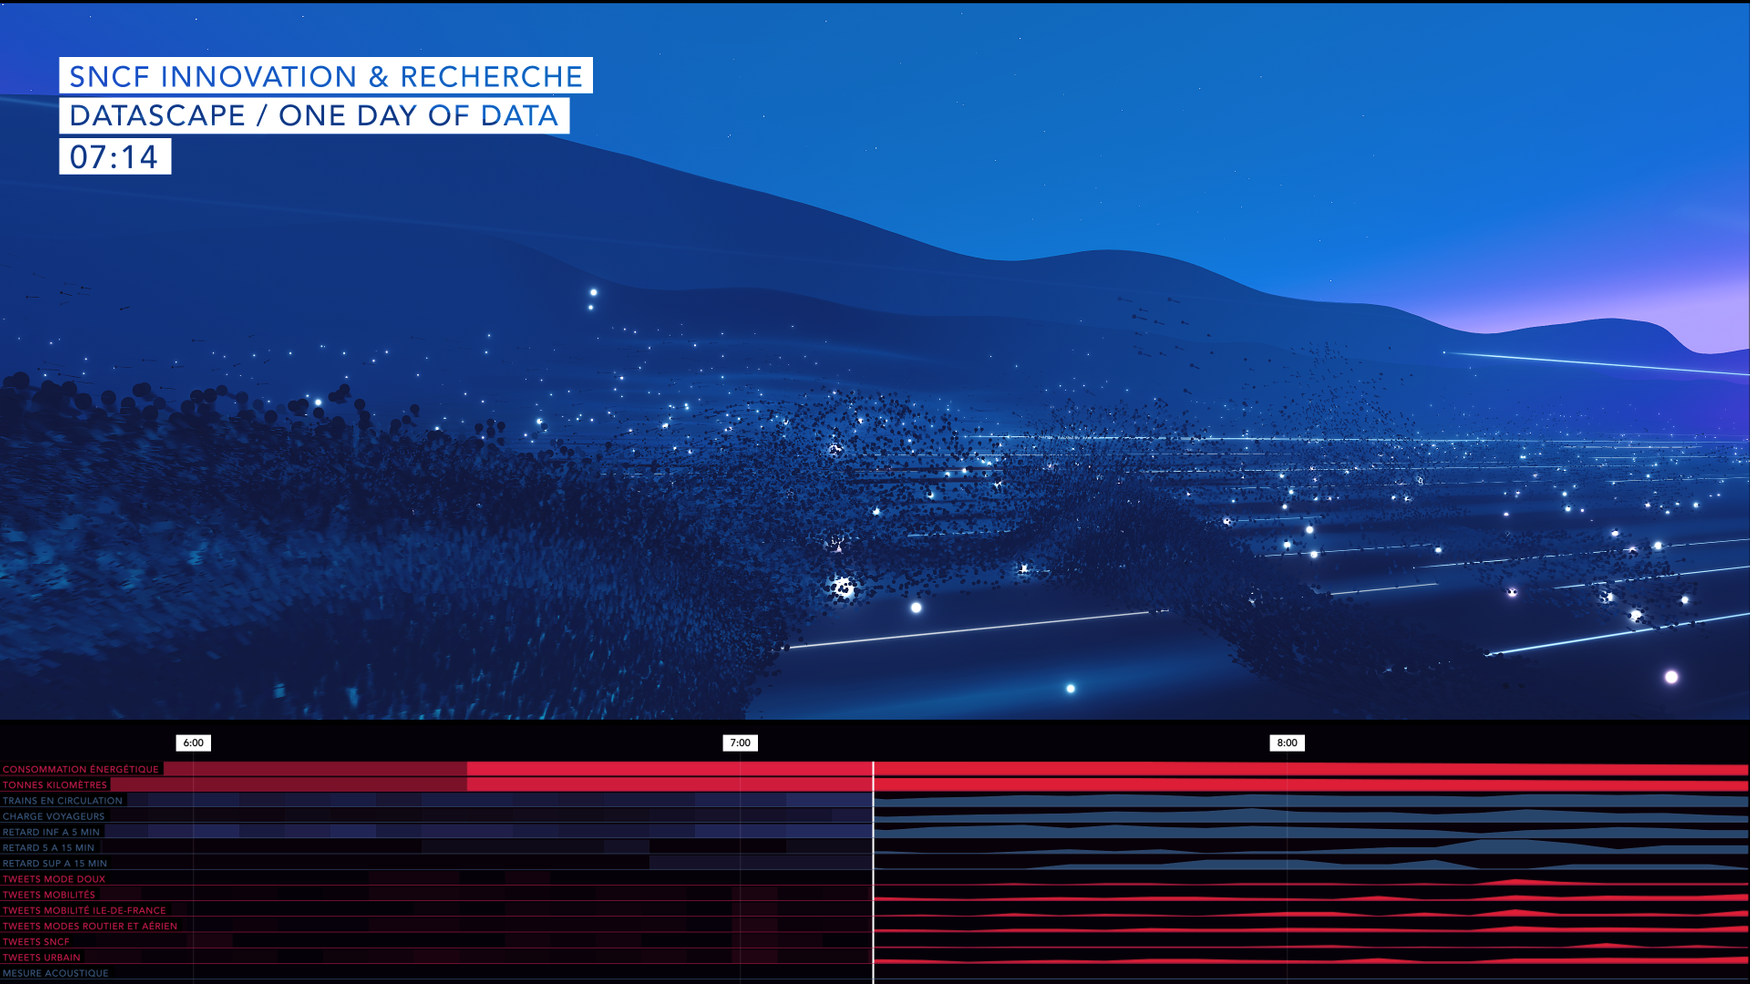
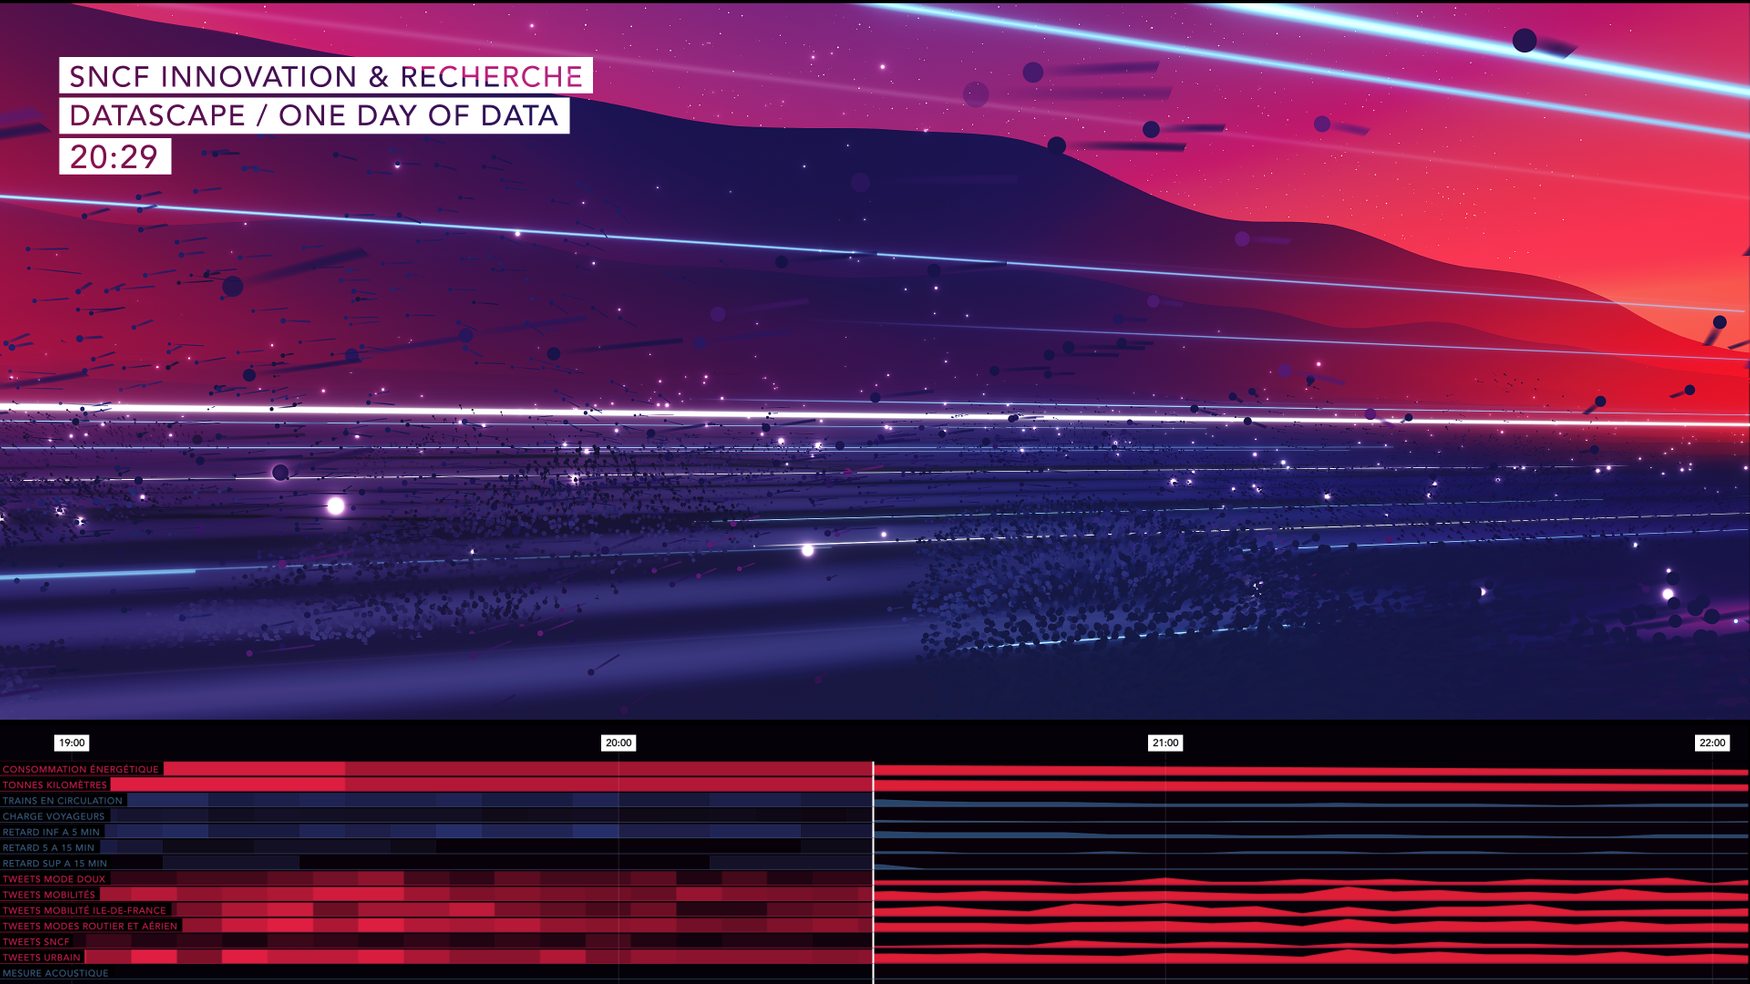
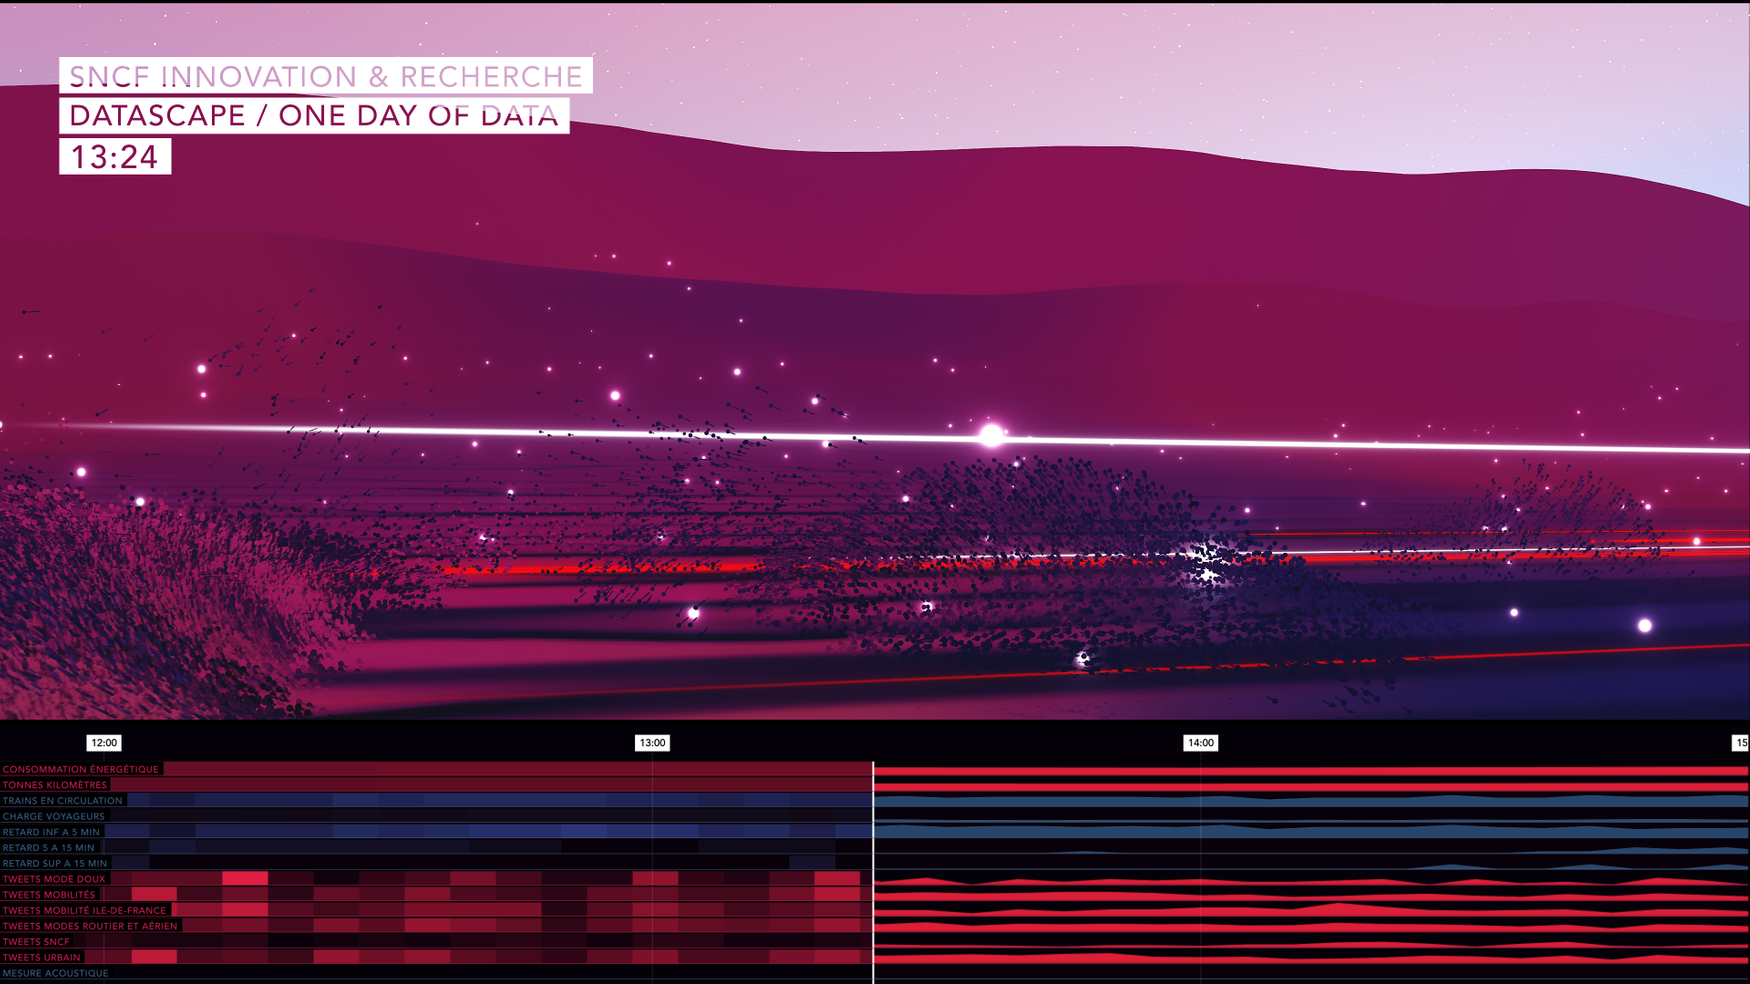
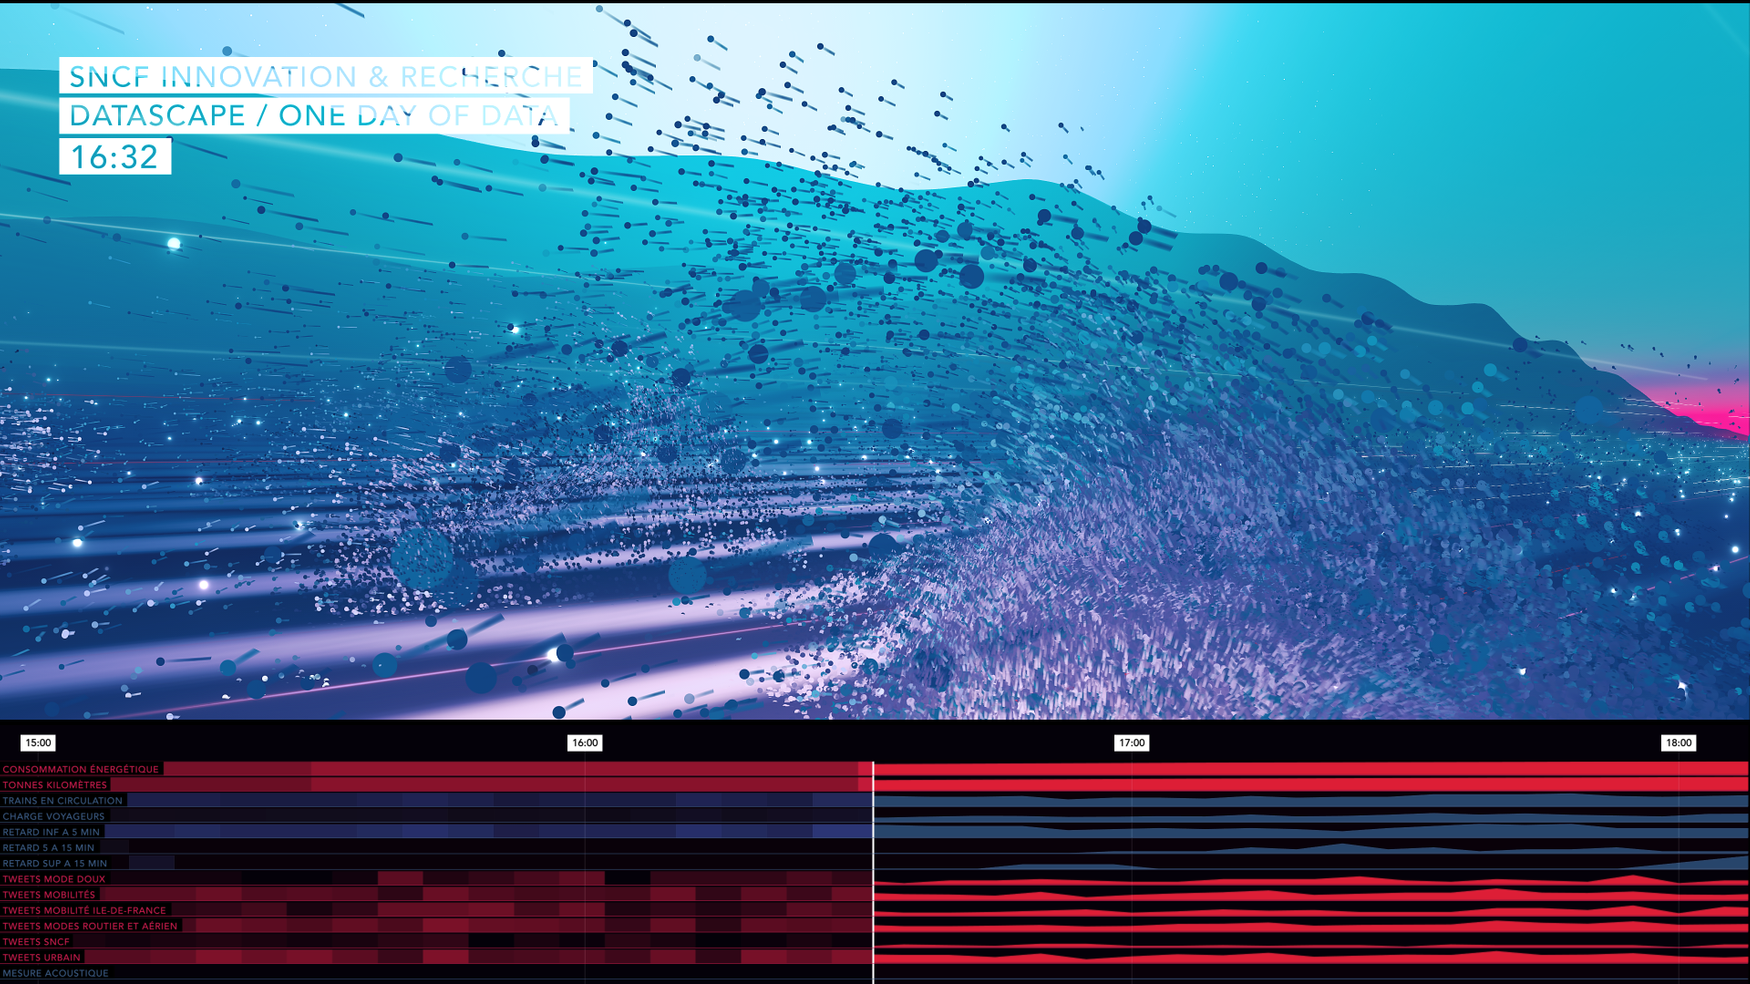
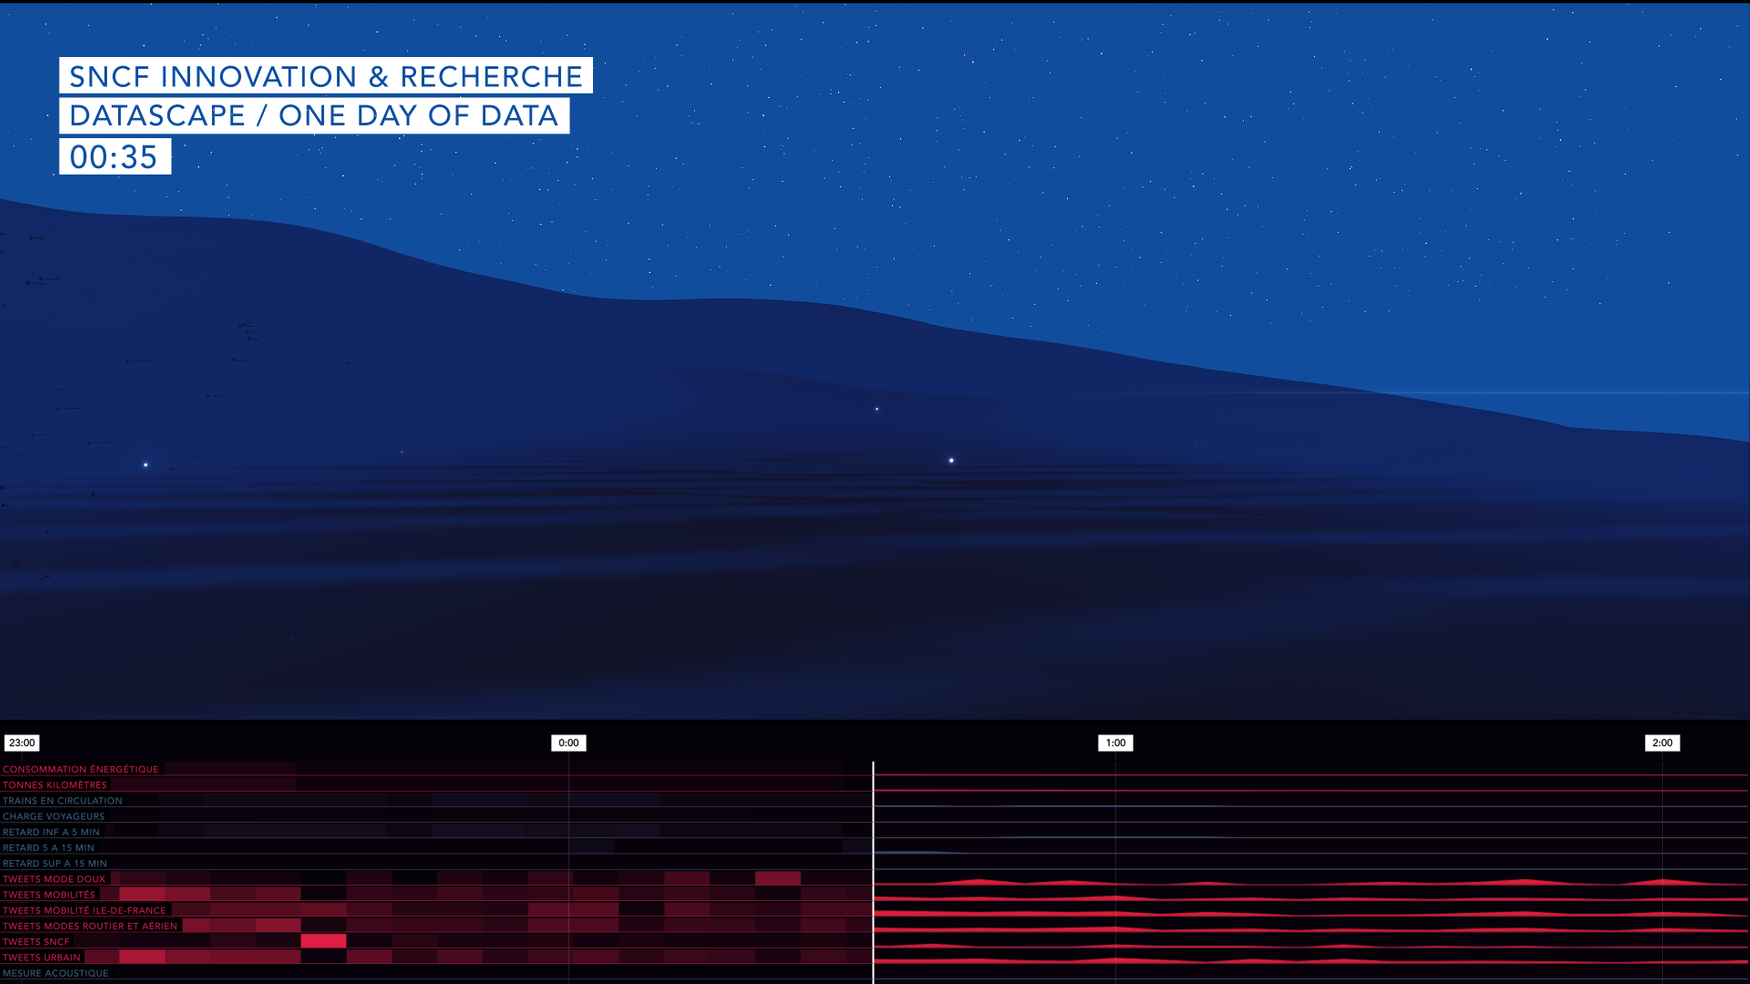
This dreamlike journey allows you to immerse yourself, the time of a journey by train, in a world generated by different datasets. Thus, the different landscape plans that are scrolling are generated respectively by a typical day of energy consumption of the network, train traffic data or the use of social networks related to mobility practices.
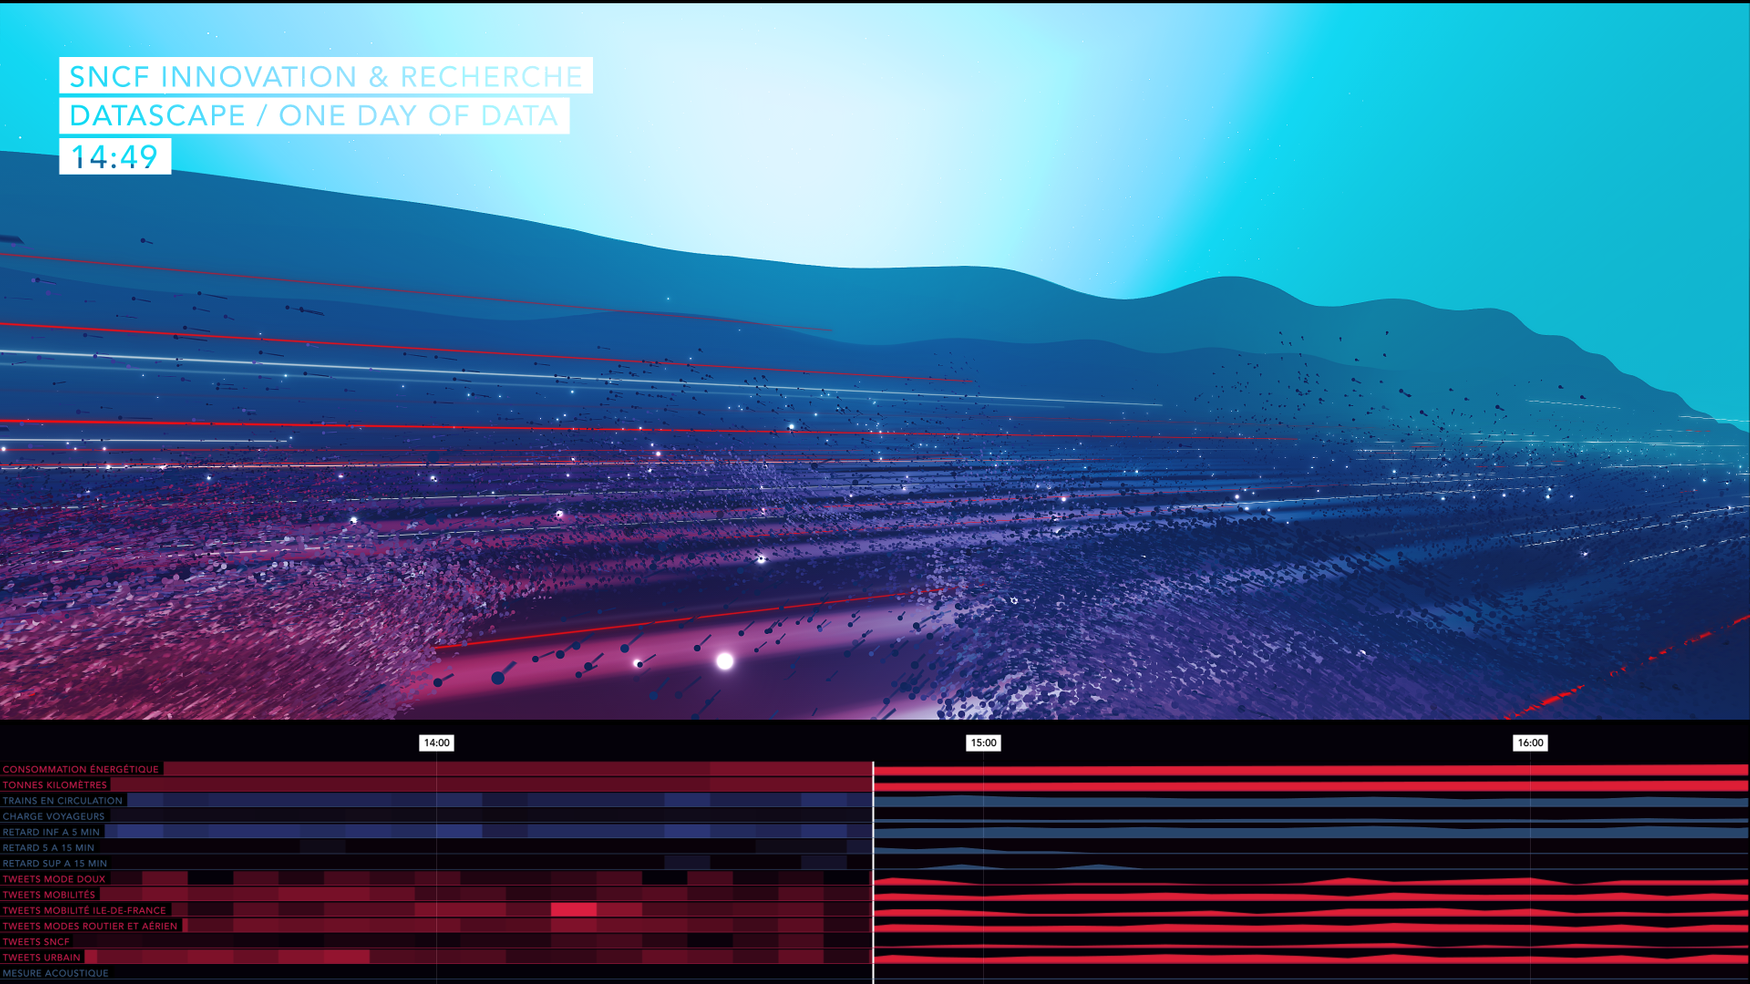
The visualization, in vertical diptych, shows the partition played, in the bottom right the raw data scrolls, a first interpretation in the form of color and texture is proposed below to left. The upper part gives way to the 3D landscape that is dynamically generated from the data. This visualization offers an unprecedented experience that takes you further into a digital world.
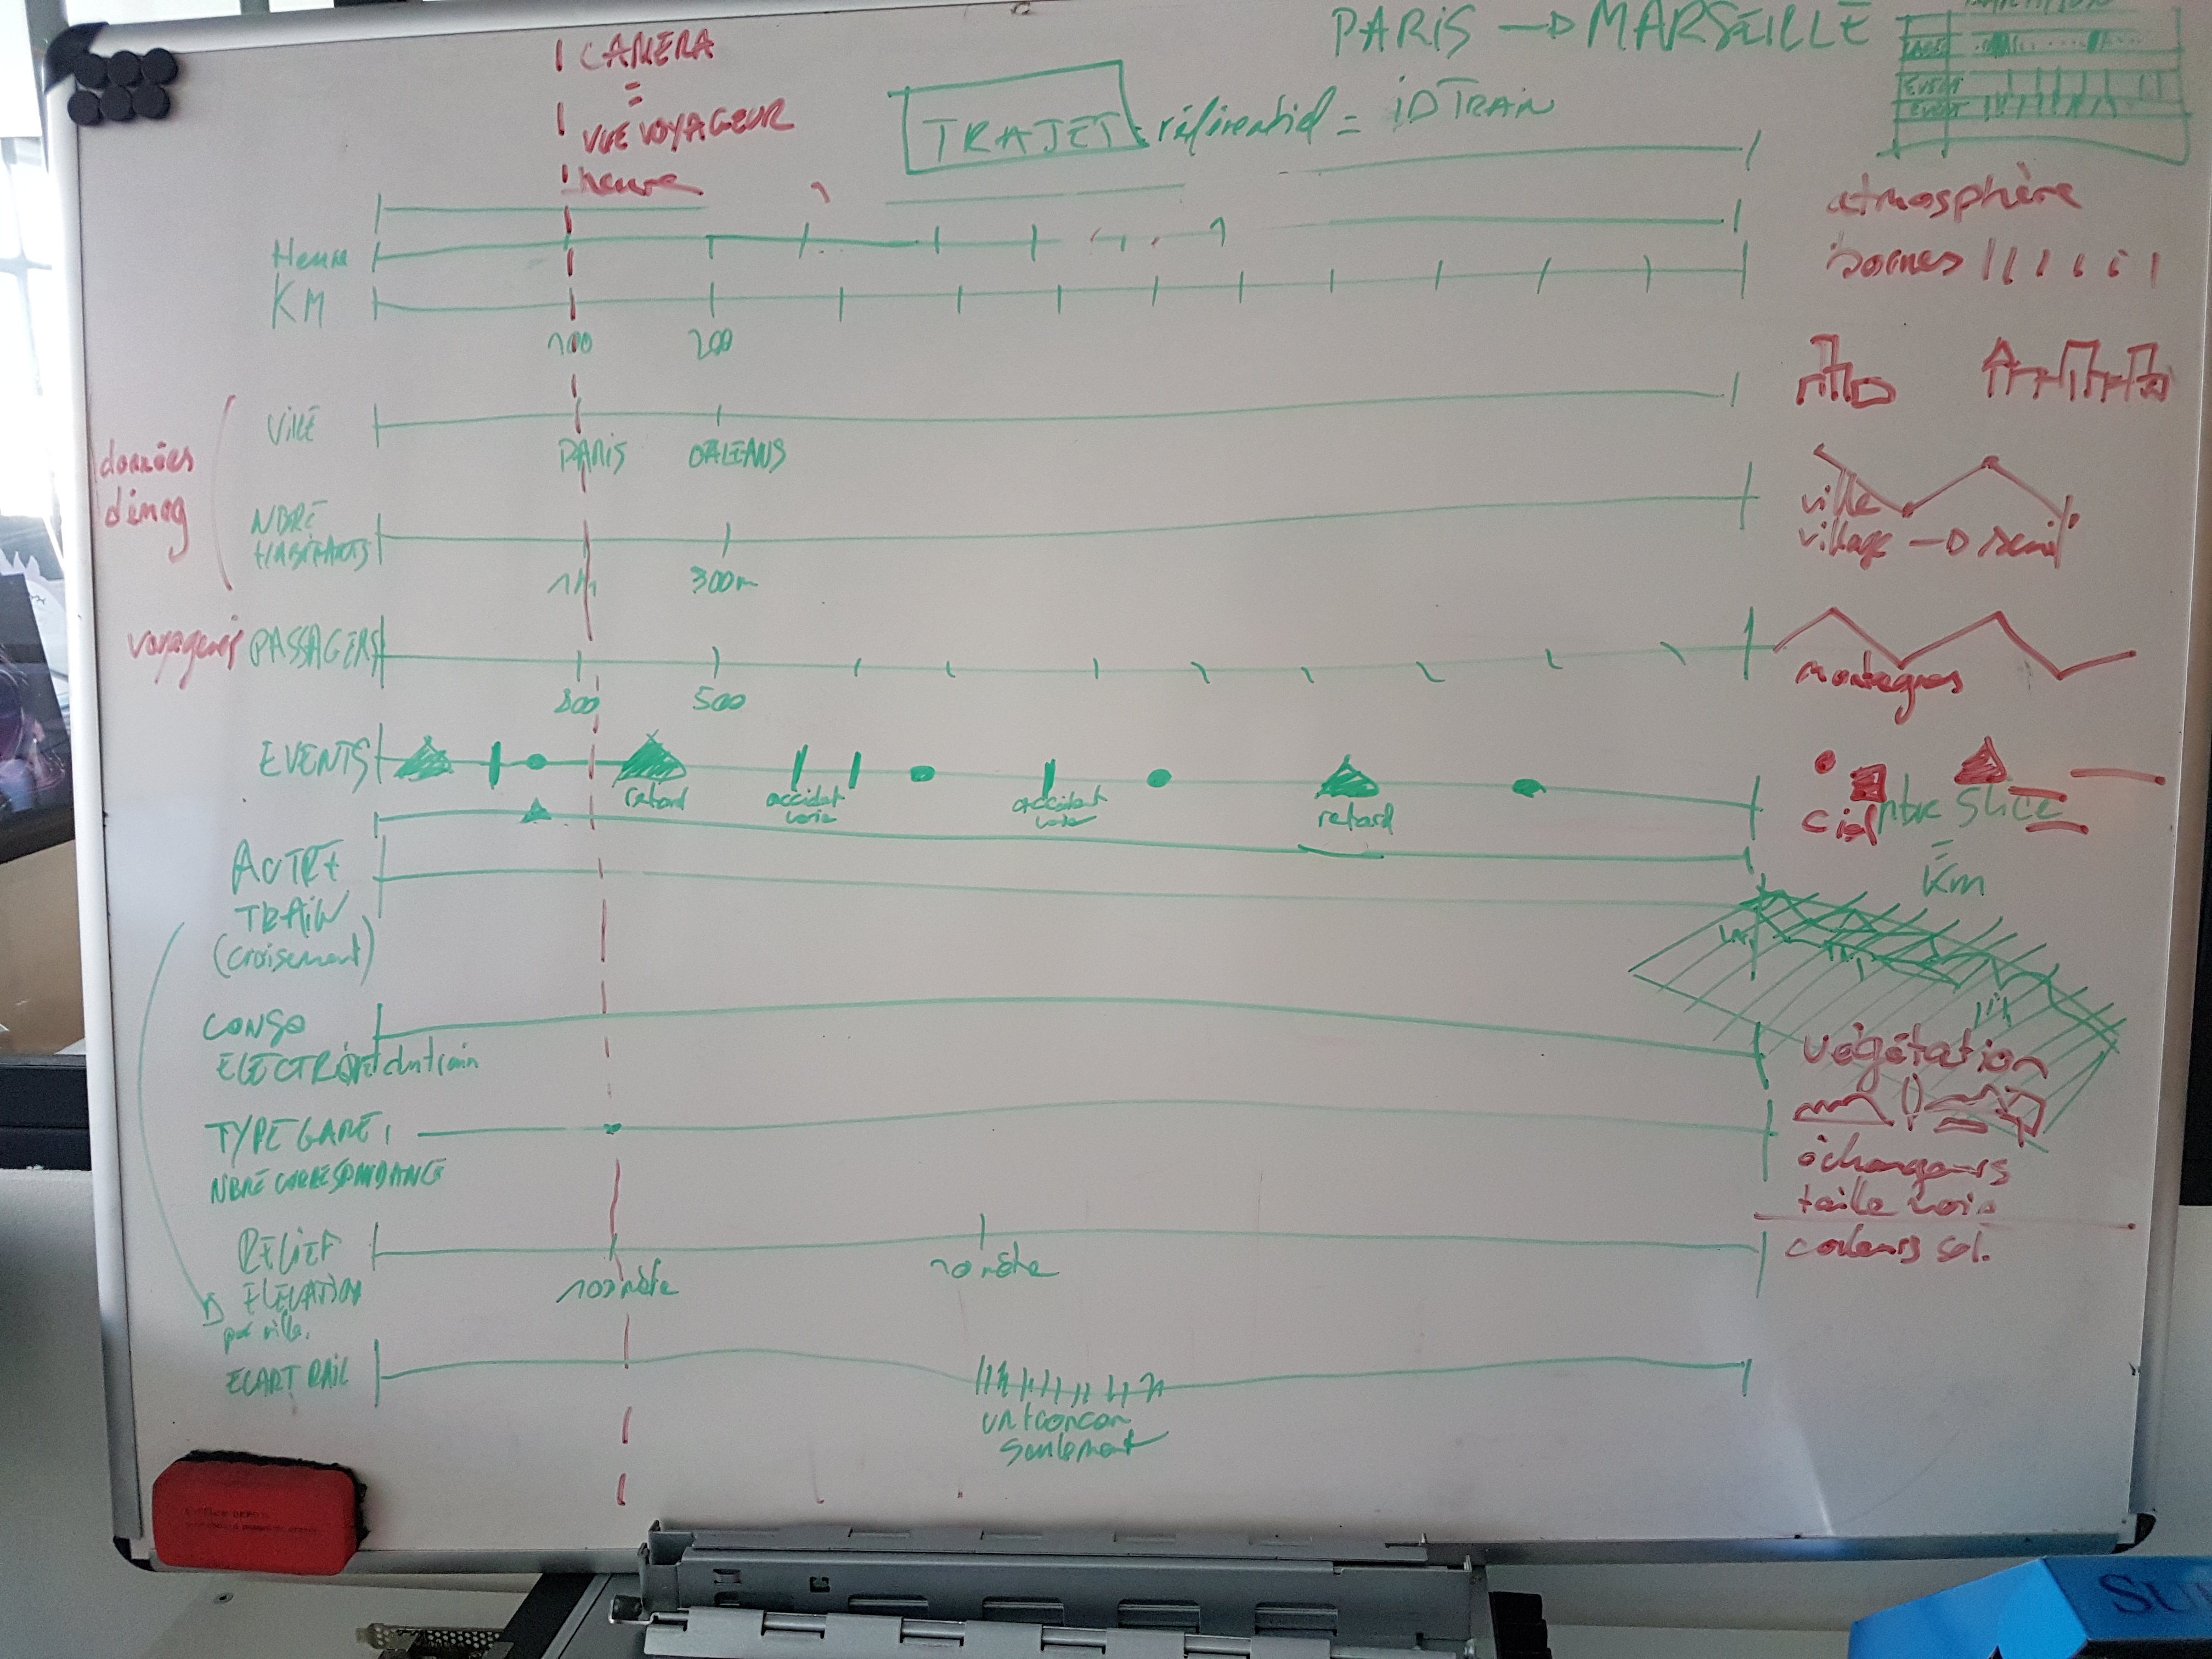
My role on this project was to get in touch with SNCF engineers and identify the data to be visualized. Subsequently I propose different design and landscapes to reflect these data. I had to create a custom timeline based on the differents data (using VVVV toolkit) and create a system to link the data and generating the landscape (using Notch).
This dreamlike journey allows you to immerse yourself, the time of a journey by train, in a world generated by different datasets. Thus, the different landscape plans that are scrolling are generated respectively by a typical day of energy consumption of the network, train traffic data or the use of social networks related to mobility practices.
The visualization, in vertical diptych, shows the partition played, in the bottom right the raw data scrolls, a first interpretation in the form of color and texture is proposed below to left. The upper part gives way to the 3D landscape that is dynamically generated from the data. This visualization offers an unprecedented experience that takes you further into a digital world.
My role on this project was to get in touch with SNCF engineers and identify the data to be visualized. Subsequently I propose different design and landscapes to reflect these data. I had to create a custom timeline based on the differents data (using VVVV toolkit) and create a system to link the data and generating the landscape (using Notch).
sequence stills


EARLY RESEARCHES / process
Previous visuals experiments also visible here.